Versions Compared

Key

  • This line was added.
  • This line was removed.
  • Formatting was changed.

Overview


Excerpt

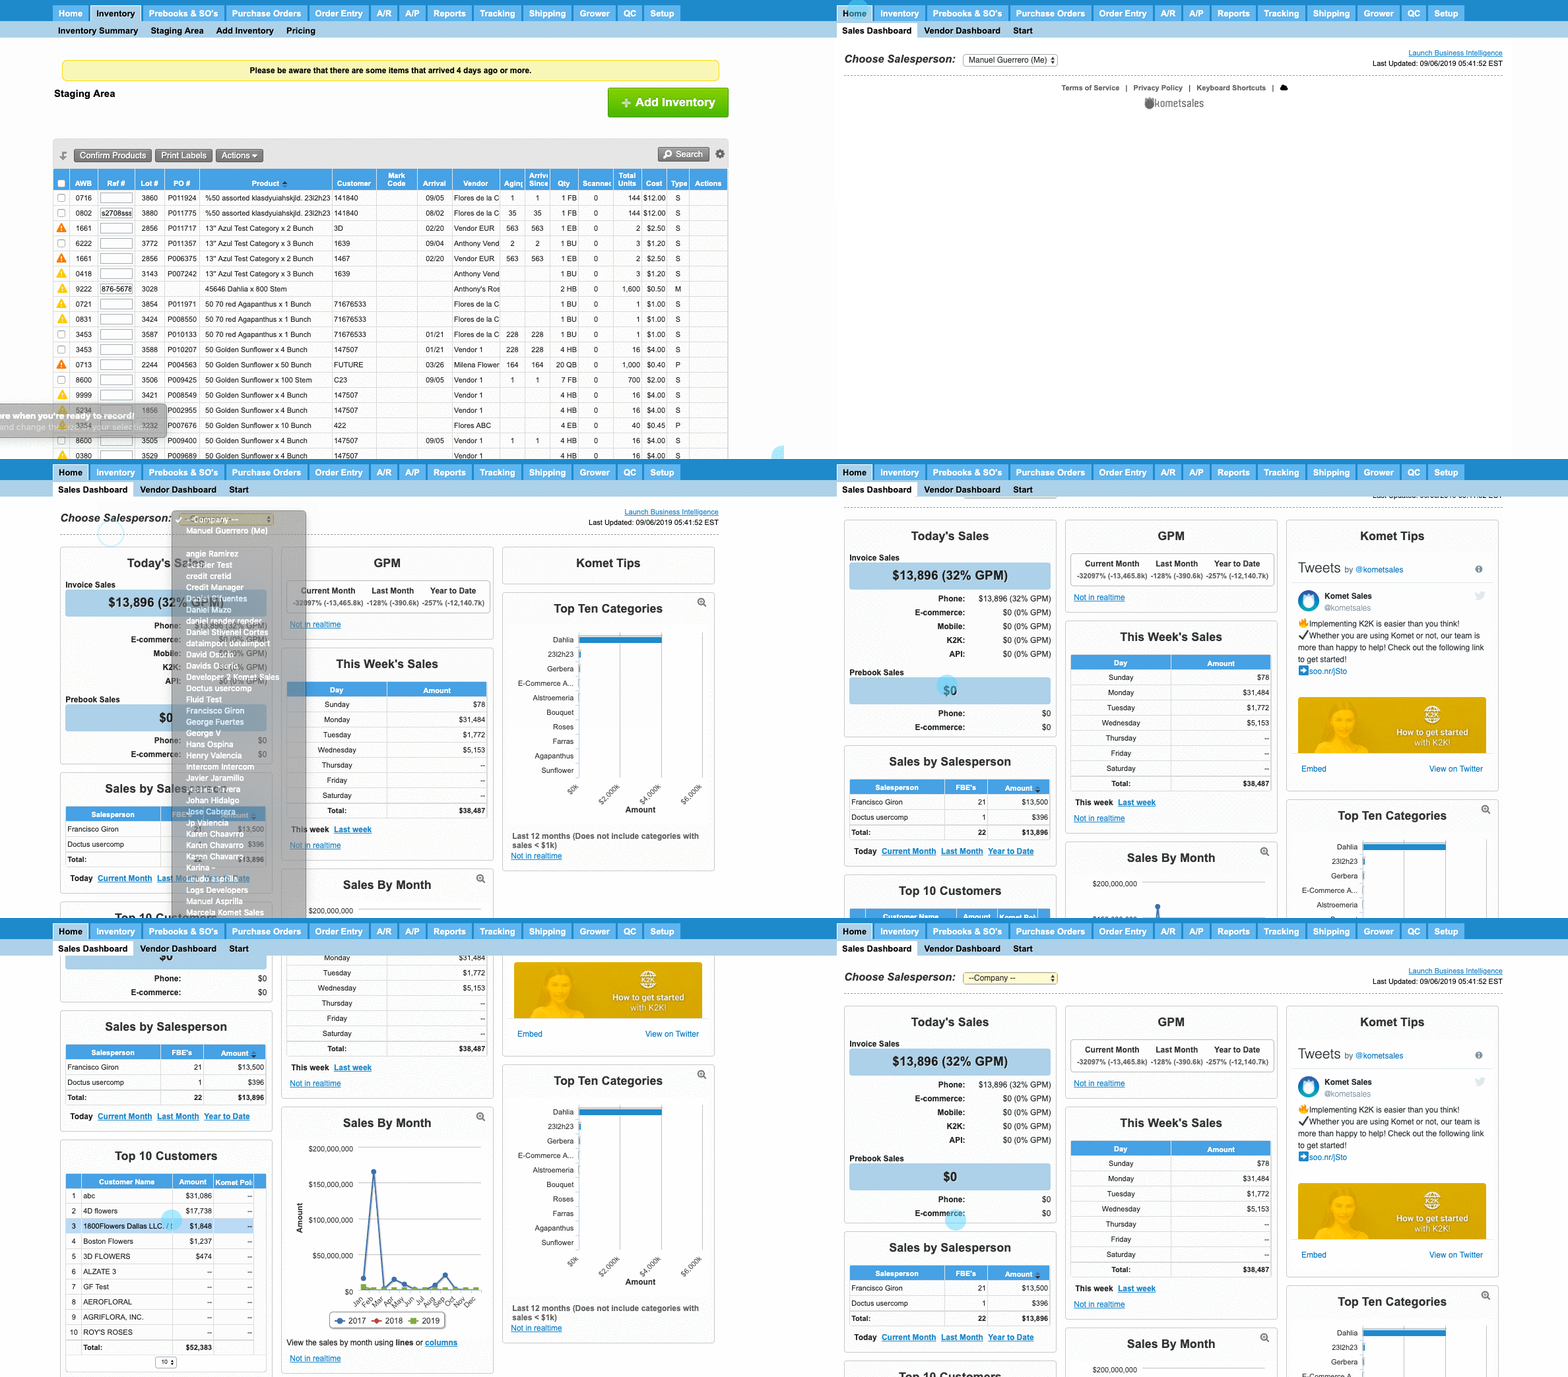
The Dashboard is displayed by default once you login into the system. And displays general data about your company's sales.


Displaying Dashboard

Ui steps
sizesmall


Ui step

Click on the Home tab.


Ui step

 Click on the Dashboard tab.


Ui step

 By clicking on the drop-down menu "Choose Salesperson", you can filter the information both for the company or for a particular Salesperson.


Panel
borderColorCerulean
bgColorWhite
titleColorWhite
titleBGColorSteelBlue
titleThe next information will be displayed:
  • Today's Sales: This chart displays a daily sales summary from E-commerce sales, phone sales, Mobile Sales, API and K2K sales both in Prebooks and Invoices. Keep in mind that the Prebook Sales widget does not include Standing Orders.
  • Sales by Salesperson: You can view a sales summary of each of your salespeople for a specify time period.
  • This Week's Sales: The system displays a weekly sales summary.
  • Top Ten Customers: The system displays the top ten of the customers during a specific time period. You can also filter by Top 15 customers and Top 25 customers during several periods.
  • Top Ten Categories: This chart displays a bar graph with the most sold flowers during the last 12 months.
  • Sales By Month: The system displays a table where you can see the sales per each month during the last three years.
  • Sales By Month: This chart displays a line or columns graph of monthly sales.
  • GPM: This chart displays a summary of the Gross Profit Margin (GPM). The GPM calculation does not consider fuel surcharge amounts nor additional invoice charges.
  • Komet Tips: It is an integration with Komet Sales twitter to get the latest updates.


Panel
titleRelated Articles

Filter by label (Content by label)
showLabelsfalse
max10
showSpacefalse
sorttitle
cqllabel in ( "dashboard" , "home-page" , "vendor-home-page" , "sales-dashboard" )
labelsdashboard home-page


...