| Anchor | ||||
|---|---|---|---|---|
|
| Excerpt | ||
|---|---|---|
In this article, you will learn about Komet Analytics and how it enables you to analyze your business data and get valuable insights from your operations.
|
Table of Contents
| Table of Contents | |||||||||||||||||||
|---|---|---|---|---|---|---|---|---|---|---|---|---|---|---|---|---|---|---|---|
|
What is Komet Analytics?
Komet Analytics is a powerful tool that can help your company make informed decisions, streamline operations, and stay ahead of the competition. By analyzing data, you can gain valuable insights that enable data-driven decision-making, improve operational efficiency, enhance customer understanding, and assess and mitigate risks. Additionally, Komet Analytics facilitates performance measurement, tracking, and resource allocation optimization. You can leverage your company's data to drive success and growth with the right decisions based on actual data. In short, analytics is an essential resource that can help you make the most of your data and achieve your business goals confidently and enthusiastically.
Komet Analytics is available as an add-on subscription. If you want to have analytics enabled, please contact us.
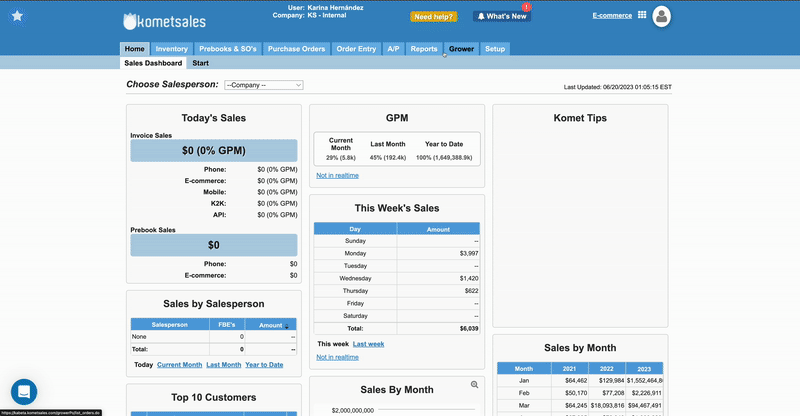
![]()
Komet Analytics Reports
The full Komet Analytics experience is available from the Reports - New tab. From here, you will be able to harness the power of all your company’s information through several dashboards that enable you to make informed business decisions.
Reports are designed in a top-bottom approach meaning that KPI summaries and general overviews are displayed at the top and information gets more detailed as you go down.
Types of Reports
Sales Managers and Report users can access two types of reports from the Reports tab, which are divided into two sections:
Procurement.
Time Range (TR). In this report, you can select a date range and see the results of that period.
Period-to-Date (PDT). In this report, you can select a period and compare it to the previous year's results in the same period. Additionally, you can use the granularity filters to increase or decrease the detail of the data shown.
Sales.
Time Range (TR). In this report, you can select a date range and see the results of that period.
Period-to-Date (PDT). In this report, you can select a period and compare it to the previous year's results in the same period. Additionally, you can use the granularity filters to increase or decrease the detail of the data shown.
In PDT reports, you can use the granularity filters to increase or decrease the detail of the data shown. The available values for granularity are year, quarter, month, week, week-day, month-day, and specific dates.
| Info |
|---|
If you want to learn more about the Reports screens, read Reports Screen. |
Access and Export Reports
To view and export new reports, do the following instructions:
Go to Reports and select New.
Select the report you want to view. The system will open Komet Analytics in a new tab.
Use the available filters to populate reports.
Optional: If you see a graph where you need more information, hover over the chart and click on the expand icon.
Give users access to Reports
Salespersons and procurement users cannot access dashboards in the New Tab unless given access. Control who can access reports with one the following methods:
Give the User the Reports Role. Users can have multiple roles. If you want to give access to reports and information of the company, go to Setup > Users and enable this role for them.
Grant Access to Own Customer Reports. You can also grant access to specific users by enabling the Access to Reports setting from the Setup > Users screen.
Procurement and Sales users will only have access to their respective category of reports unless given a Reports user role.
Available Filters
The primary filters in these dashboards are Customer, Product, Salesperson, Vendor, Company Location, Customer Type, Customer Group, Unit Type, Order Type, Sales Channel, and data granularity.
| Info |
|---|
Mult-Location Company users can select the location they want to use for their reports by opening a report, clicking on Company Location, and selecting the one they want to review. |
Explanation Videos
| Child pages (Children Display) | ||||
|---|---|---|---|---|
|
FAQs
| Expand | ||
|---|---|---|
| ||
The graphs represent your KPI's evolution over the determined time range. |
| Expand | ||
|---|---|---|
| ||
You can select the access they will have. Komet Analytics uses role-based-access-security. As an admin, you can access all dashboards and reports on the new KA experience. However, a Salesperson is limited to viewing only Sales reports, which also applies to Procurement users and reports. Additionally, users with custom access can only see their own data, not those of other users. To give a user custom access, enable the Access to Reports setting from the Setup > Users screen. |
| Expand | ||
|---|---|---|
| ||
Yes, when you open a report dashboard, you can select the Salesperson at the top of the page. You can also select more than one salesperson if you want to review a particular group’s metrics. |
| Expand | ||
|---|---|---|
| ||
These four dashboards have all the information you need in a single, more organized place and environment, removing the need to jump from one dashboard to another when analyzing information. |
| Expand | ||
|---|---|---|
| ||
Yes, you can use as many as you need. Remember to also use exclusions when needed to increase data accuracy. |
| Expand | ||
|---|---|---|
| ||
When filtering by Customer, you can view all pertinent data regarding a particular customer or company. On the other hand, filtering by Customer Type allows you to analyze data according to the customer's role or type within the industry. |
| Expand | ||
|---|---|---|
| ||
We added a Customer to Exclude filter you can see at the top of the report page. In there, you can add accounts used for internal operations, customers you don’t want in the reports, or “dump accounts” to prevent them from altering the metrics. |
| Expand | ||
|---|---|---|
| ||
Certainly. You can locate Pivot Tables with the same conditionals as the rest of the reports at the bottom section of the reports. |
| Expand | ||
|---|---|---|
| ||
Yes. You can see a comprehensive report on customers and salespeople, and you can also filter them individually or by groups. |
| Expand | ||
|---|---|---|
| ||
You can break the KPIs into "Sales by Unit Type, Sales by Sales Channel, Sales by Sales Type, Sales by Inventory Division, and Sales by Category Division. |
| Filter by label (Content by label) | ||||||||
|---|---|---|---|---|---|---|---|---|
|
...